The Cheapest States For Car Insurance In 2025
Do you know if you live in one of the cheapest states for car insurance?
Not sure? Neither were we!
So, we did some research and the following is what we found.
We started our research with the National Association of Insurance Commissioners (NAIC), which publishes a report that details the states to purchase cheap car insurance.
The report shows the cheapest states for car insurance are:
- Idaho
- Iowa
- Indiana
- Maine
- Wisconsin
They have held these places as the cheapest states for car insurance since 2011, where policyholders could expect to pay lower rates for their policies than customers in the states.
South Dakota replaced Indiana in 2013 as one of the cheapest states for this type of insurance. But Indiana rallied to once again make the top five in 2014 and has remained on the top five cheapest states ever since.
But why is auto insurance cheaper in these states?
Well, we consulted the 2017 report by the National Association of Insurance Commissioners and the FBI’s crime in the U.S. report to weigh factors held by policyholders in each state like:
- Traffic Conditions
- Crime Rates
- Population Density
- Disposable Income
Oh, and you can find the full listing of car insurance by state at the end of the article.
Idaho Remains The Cheapest State For Car Insurance
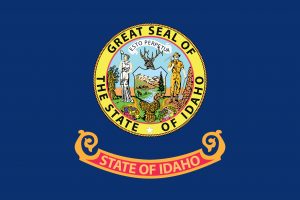
Idaho has been the cheapest state for car insurance in the country for five years straight. Go Idaho!
In 2011, auto insurance premiums in the state were $267 less than the national average.
While rates in 2015 were roughly $40 higher per year than in 2011, they were approximately $330 less than the national average. That’s a big saving!
- Average Cost of Car Insurance in Idaho in 2011 $641.96
- Average Cost of Car Insurance in Idaho in 2012 $639.19
- Average Cost of Car Insurance in Idaho in 2013 $650.57
- Average Cost of Car Insurance in Idaho in 2014 $673.13
- Average Cost of Car Insurance in Idaho in 2015 $679.89
Idaho Traffic Conditions
In 2014, Idaho experienced 0.11 fatalities per 1,000 registered vehicles.
This is compared to the national rate of 0.13 fatal accidents per 1,000 registered vehicles. Additionally, the number of vehicle miles per highway mile is 330,335, compared to the national average of 724,348.
Since there are fewer vehicles on the road in Idaho, there is less opportunity for accidents and a lesser degree of risk for insurers.
Idaho Crime Rates
When it comes to vehicle thefts, Idaho ranks in the bottom nine states in the nation.
Of the 29,357 property crimes that were reported in 2016, just 2,077 of those were related to motor vehicle theft. Motor vehicles were stolen at a rate of 123.4 per 100,000 people, versus the national rate of 236.9 thefts per 100,000 people.
Because vehicle thefts are low in Idaho, there is a decreased risk for insurers. The top three vehicle years makes, and models stolen in Idaho include full-size Ford Pickups, full-size Chevy Pickups, and Honda Accords.
Idaho Population Density
In 2014, the number of people per square mile in Idaho was 20, compared to the U.S. average of 90 people per square mile.
This translates into fewer cars on the road and a lower potential for accidents.
Idaho Disposable Income
In Iowa, the average disposable income per capita was $33,600 versus the national average of $40,859.
Since, on average, residents in Idaho have less money to spend on auto insurance and big-ticketed vehicles, they may be more likely to carry less coverage.
This drives down costs for non-state-mandated coverage and fuels competition among insurance providers.
Read more: Best Car Insurance Listed By State
Iowa Is the Second-Cheapest State for Auto Insurance
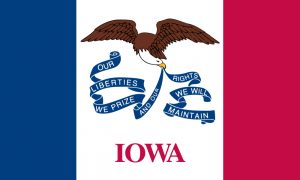
Iowa has ranked as the second-cheapest state for car insurance in the nation for five years running.
In 2011, drivers paid an average of $648.99 versus the national average of $908.43.
The average rate for coverage in 2015 in Iowa was $702.46, which was about $307 less than the countrywide average. Again, that’s a big difference!
- Average Cost of Car Insurance in Iowa in 2011 $648.99
- Average Cost of Car Insurance in Iowa in 2012 $656.84
- Average Cost of Car Insurance in Iowa in 2013 $668.09
- Average Cost of Car Insurance in Iowa in 2014 $683.67
- Average Cost of Car Insurance in Iowa in 2015 $702.46
Iowa Traffic Conditions
In Iowa, the number of vehicle miles per highway mile in 2015 was 275,141, which is nearly 450,000 less than the national average.
The state saw 1.02 fatal accidents per 100 million vehicles, compared to the national average of 1.08 fatalities. Since Iowa’s roads are less congested than other roads in the nation, there are fewer accidents, and therefore fewer insurance claims filed, resulting in lower insurance premiums for drivers.
Now, that’s a lot of breathing room on and off the road right?
Iowa Crime Rates
In Iowa, full-size pickup trucks, including Chevrolet pickups, Ford, and Dodge pickups, are the vehicles most likely to be stolen.
In 2016, there were 65,391 property crimes reported there, and just 4,983 of those were vehicle thefts. The rate of vehicle thefts in 2016 was 1.22 per 1,000 registered vehicles, which is significantly lower than the national average of 2.74 vehicle thefts.
Vehicles are less likely to be stolen in Iowa, which is great news for Iowans insurance providers are less likely to have to pay out for theft.
Iowa Population Density
In Iowa, there is an average of 56 people for every square mile, which is less than two-thirds the national average.
Because there are fewer exposures to risk for insurers, they are able to offer lower premiums for policyholders.
Iowa Disposable Income
The average Iowa household has roughly $39,820 in annual disposable income, which is slightly less than the national average.
Because drivers have less money to put towards the cost of insurance, they may be more likely to carry only state-minimum coverage on their (moderately-priced) vehicles.
This factor may drive down the cost for comprehensive and collision coverage.
Maine Has the Third-Cheapest Auto Insurance Rates in the Nation

Since 2011, Maine has ranked as the third cheapest state for car insurance.
Drivers paid an average of $662.28 in annual premiums in 2011, which is about $246 lower than the national average.
By 2015, state premiums had risen to $703.82, a little over $300 less than the national average of $1,009.38.
- Average Cost of Car Insurance in Maine in 2011. $662.28
- Average Cost of Car Insurance in Maine in 2012 $667.66
- Average Cost of Car Insurance in Maine in 2013 $674.94
- Average Cost of Car Insurance in Maine in 2014 $689.12
- Average Cost of Car Insurance in Maine in 2015 $703.82
Maine Traffic Conditions
Maine highways see about 624,083 vehicle miles per square highway mile, compared to the national average of 724,348.
Thanks, in part, to the lighter traffic, there were 0.11 fatal accidents per 1,000 registered vehicles, versus the national average of 0.13 fatalities. These conditions pose less of a risk for insurance providers, allowing them to offer coverage at lower rates.
Besides the state’s natural beauty, Maine is a great bargain for car insurance.
Maine Crime Rates
Maine has the second-lowest rate of stolen vehicles in the U.S., with 0.70 thefts per 1,000 registered vehicles versus the national rate of 2.74 vehicle thefts.
Of the 21,912 property crimes were reported in Maine in 2016, about 3.5% or 775 of those were vehicle thefts. This may cause a decrease in auto insurance premiums since there is a decreased likelihood of a policyholder’s vehicle being stolen.
The top three vehicles most commonly stolen in Maine include Chevrolet, Ford, and GMC pickups.
Maine Population Density
The population density in Maine is less than half the national average, with just 43 people per square mile.
Man, that is a lot of open space! Because there are fewer drivers on the road at any given time in Maine, there is a lower risk of accidents and insurers are less likely to pay out for collisions.
Maine Disposable Income
Maine residents have an average of $37,049 per year in disposable income, which is nearly $4,000 below the national average.
Since Mainers have less money for things like auto insurance, insurance companies must offer more affordable rates on policies to continue generating sales.
Wisconsin Ranks Fourth in the Cheapest States for Car Insurance for Five Years Running
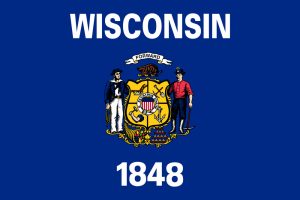
Since 2011, Wisconsin has consistently ranked as the fourth-cheapest state for car insurance.
In 2011, auto insurance premiums in this state were roughly $240 less than the countrywide average.
While annual premiums saw an increase of $67 between 2011 and 2015, Wisconsinites still paid $272 less than the national average. Go Packers!
- Average Cost of Car Insurance in Wisconsin in 2011 $669.99
- Average Cost of Car Insurance in Wisconsin in 2012 $666.79
- Average Cost of Car Insurance in Wisconsin in 2013 $689.77
- Average Cost of Car Insurance in Wisconsin in 2014 $716.83
- Average Cost of Car Insurance in Wisconsin in 2015 $737.18
Wisconsin Traffic Conditions
In Wisconsin, there are 521,242 vehicle miles per highway mile, which is considerably less than the national average of 724,348 vehicle miles.
This means that there are, on average, fewer cars on Wisconsin highways than on highways in other states. Additionally, there are 0.10 traffic fatalities per 1,000 registered vehicles, compared to the national average of 0.13 fatalities.
Because roads are less congested and there are fewer serious accidents in Wisconsin, insurers can provide cheaper coverage.
Wisconsin Crime Rates
Of the 111,720 property crimes reported in Wisconsin in 2016, 9,958 of those were vehicle thefts.
There are 1.96 vehicle thefts for every 1,000 registered vehicles in the state, compared to the national average of 2.74. Wisconsinites are statistically less likely to have to file a claim under their comprehensive coverage for vehicle theft, allowing insurers to provide coverage at a lower cost.
The vehicles most commonly stolen in this state include Dodge Caravans, Honda Civics, and Honda Accords.
Wisconsin Population Density
The population density in Wisconsin is high relative to the countrywide average, with 106 people per square mile.
Because of this, there is a statistically higher risk of car collisions, which may account for Wisconsin only coming in as the fourth cheapest state for car insurance.
Wisconsin Disposable Income
Wisconsin residents have an average of $39,433 in annual disposable income, meaning they have a little over $1,400 less than the average U.S. household for such things as auto insurance.
As a result, auto insurance providers must sell their policies for less than they would in other states where residents have more disposable income.
Indiana Is the Fifth-Cheapest State for Car Insurance Since 2013
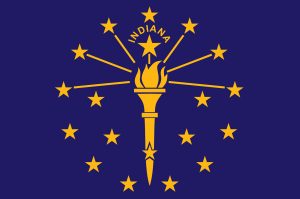
In 2013, Indiana replaced South Dakota in the top five cheapest states for car insurance.
From 2012 to 2013, South Dakota’s average annual auto insurance premium rose from $690.95 to $717.30, while Indiana’s dropped from $724.44 to $704.50.
In 2015, the average annual auto insurance premium in Indiana was $755.03, which is a little over $250 less than the national annual premium. Go Hoosiers!
- Average Cost of Car Insurance in Indiana in 2011 $710.36
- Average Cost of Car Insurance in Indiana in 2012 $724.44
- Average Cost of Car Insurance in Indiana in 2013 $704.50
- Average Cost of Car Insurance in Indiana in 2014 $728.93
- Average Cost of Car Insurance in Indiana in 2015 $755.03
Indiana Traffic Conditions
Indiana highways are pretty busy, with 819,082 vehicle miles per highway mile.
This is significantly more than the countrywide highway density of 724,348 vehicle miles per highway mile. However, in spite of the increased traffic density, the state’s fatal accident rate is on par with the national average of 0.13 fatalities per 1,000 registered vehicles.
While Indiana highways are more congested than other highways in the country, which may result in higher insurance premiums, the fact that the rate of accidents resulting in fatalities is the same as the nation’s may offset that increase.
Indiana Crime Rates
In 2016, there were 171,759 property crimes reported in Indiana, and 14,731 of those were vehicle thefts.
There are 2.39 vehicle thefts per 1,000 registered vehicles in this state, versus the national average of 2.74 thefts. Because cars are statistically less likely to be stolen in the state, insurers are also less likely to pay out for vehicle thefts and can, therefore, charge a lower premium on comprehensive coverage.
The most common vehicles stolen in the state are Ford pickups, Chevrolet pickups, and Chevrolet Impalas.
Indiana Population Density
Indiana is a populous state with 184 people per square mile.
This is more than double the national average of 90 people per square mile. While Indiana ranks among the cheapest states in the nation for auto insurance, the higher population may adversely affect insurance rates.
Indiana Disposable Income
The average Hoosier has an average of $36,364 in annual disposable income, compared to the national average of $40,859.
To generate sales and ensure that customers buy coverage beyond what the state mandates, insurance companies must offer products at a lower price. In addition, Indianans may drive less expensive-to-insure vehicles due to lower income rates.
Here are some other cheaper states for car insurance:
- Alabama
- Arizona
- California
- Colorado
- Connecticut
- Delaware
- Georgia
- Florida
- Hawaii
- Illinois
- Louisiana
- Maryland
- Massachusetts
- Michigan
- Minnesota
- Missouri
- New Jersey
- New York
- North Carolina
- Oregon
- Texas
- Utah
- Virginia
- Washington
Read more:
- Best Cheap Car Insurance in New York
- Best Cheap Car Insurance In Massachusetts
- Best Cheap Car Insurance In Delaware
- Best Cheap Car Insurance in Connecticut
In Conclusion
Understanding the impact that traffic conditions, crime rates, population density, and average disposable income have on the cost of auto insurance in different states can help you know what to expect in your region.
Happy and safe driving!

